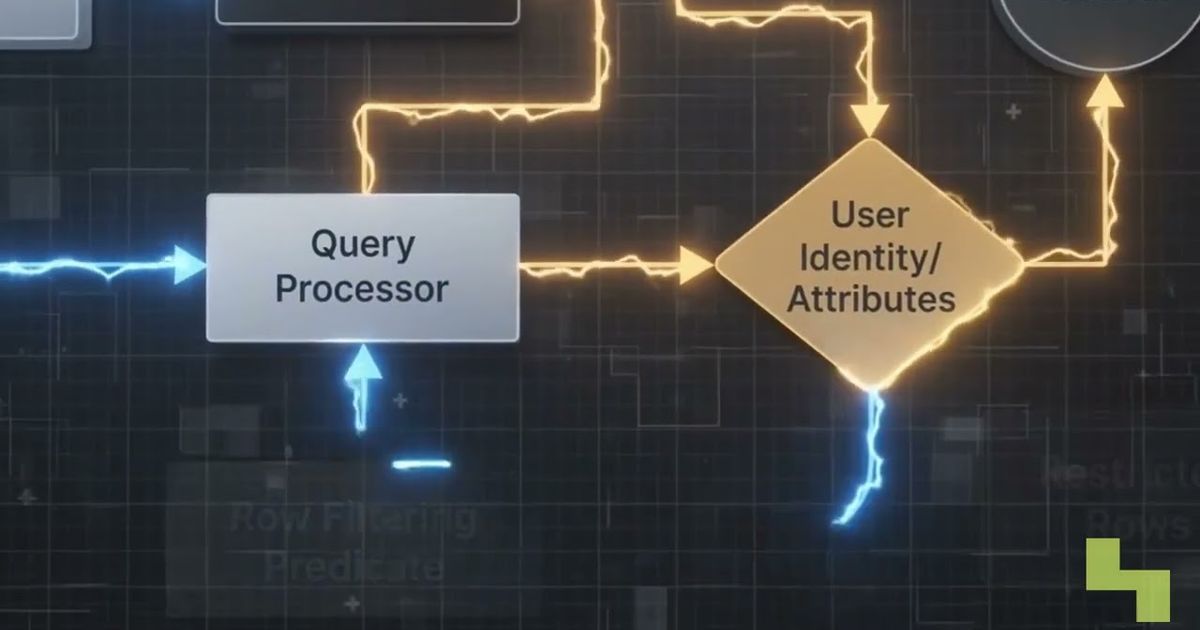
Data observability is the continuous monitoring of data systems through telemetry about volume, freshness, schema, distribution, and lineage. It detects silent pipeline failures and unexpected data changes, shows which downstream assets are affected, and helps engineers trace incidents to upstream sources before corrupted data undermines analytics, machine learning, or automated decisions.
This matters because a failure in one ingestion job or transformation can propagate through dashboards, applications, models, and automated workflows before users recognize the problem. Observability helps engineering teams intervene earlier, reduce pipeline downtime, and preserve trust in operational data. The video above walks through the core ideas.
What is data observability?
Data observability is the ability to understand the health and behavior of data across an end-to-end architecture. It collects and correlates telemetry from ingestion, storage, transformation, orchestration, and consumption layers so teams can detect and investigate problems that ordinary infrastructure monitoring may miss.
Infrastructure monitoring can confirm that a database is reachable or a pipeline job completed. It does not necessarily reveal that the job loaded half the expected records, delivered stale data, changed a column type, or introduced an abnormal value distribution.
Data observability addresses that gap by examining the data itself alongside pipeline operations. It complements data quality practices, which define and enforce expectations such as validity, completeness, consistency, and accuracy. Tests validate known rules, while observability can expose unanticipated behavior across complex production systems.
The objective is not to promise error-free data. It is to make silent failures visible, assess their downstream consequences, and give teams enough context to respond before unreliable data reaches business analytics or automated applications.
What are the five pillars of data observability?
The five commonly tracked pillars are volume, freshness, schema, distribution, and lineage. Together, they describe whether expected data arrived, arrived on time, retained its structure, contains plausible values, and reached downstream systems through known paths.
- Volume tracks row counts, file sizes, event counts, or other measures of how much data arrived. Unexpected increases or decreases can indicate duplication, dropped records, or upstream outages.
- Freshness measures when data was last updated and whether ingestion follows its expected timing. A successful but delayed pipeline can still make a dashboard or model unreliable.
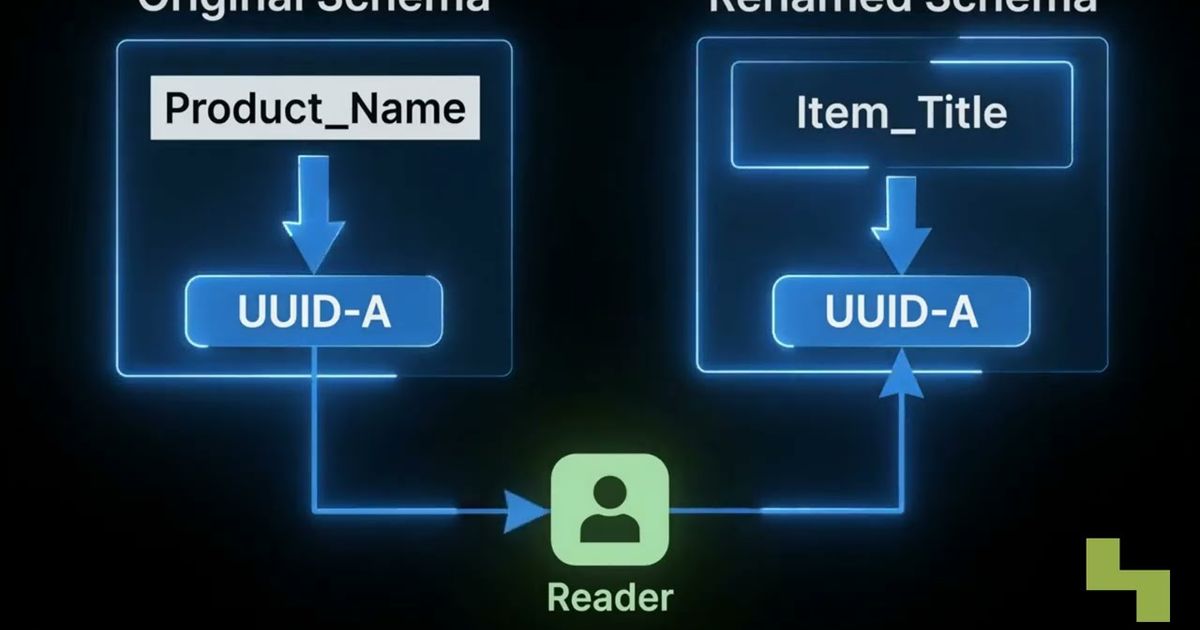
- Schema detects changes to columns, fields, types, constraints, and nested structures. Uncoordinated schema drift can break transformations and applications or silently produce null values.
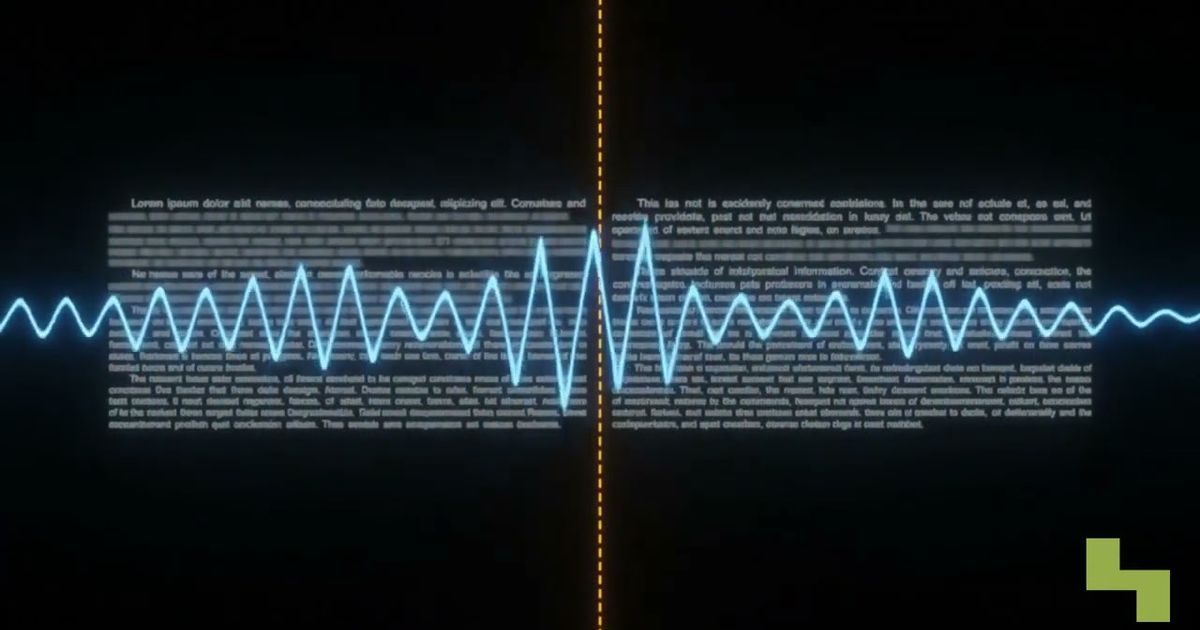
- Distribution monitors statistical properties such as ranges, null rates, categories, and value frequencies. A pipeline may run successfully while producing implausible or shifted data.
- Lineage maps relationships among sources, transformations, tables, models, reports, and applications. It provides the context needed to estimate impact and investigate causes.
These signals become more useful when correlated. For example, a schema change followed by a drop in downstream row volume and a shift in null rates provides a stronger incident signal than any metric considered alone.
How does data observability detect and diagnose failures?
A data observability system establishes expected behavior, detects anomalies, alerts the responsible team, and traces the problem through lineage. Statistical methods can learn baselines for row counts, ingestion times, and value distributions without requiring engineers to write a fixed threshold for every asset.
When new telemetry departs from those baselines, the platform can generate an alert. Useful alerts identify the affected asset, explain the anomalous signal, provide relevant history, and distinguish a likely incident from routine variation.
Automated lineage then maps which downstream datasets, reports, models, or applications depend on the affected node. This is especially important for operational machine learning: corrupted features or stale inputs may produce flawed predictions even when the model-serving system itself remains healthy.
Root cause analysis works in the opposite direction. Engineers trace bad records or anomalous metrics through upstream pipeline nodes to find the source, such as a delayed ingestion job, changed source field, or breaking transformation. This workflow turns monitoring telemetry into an actionable incident investigation rather than another isolated alert.

How do you implement end-to-end data observability?
Effective implementation starts with critical data products and extends monitoring across their complete paths. Instrumenting only the warehouse or final table leaves blind spots in source systems, ingestion, transformations, orchestration, and downstream consumption.
A practical rollout includes the following steps:
- Map critical data flows. Identify the sources, ingestion paths, transformations, stores, and consumers supporting important decisions and automated workflows.
- Capture the five core signals. Collect volume, freshness, schema, distribution, and lineage telemetry at relevant points in each flow.
- Set expectations and ownership. Combine learned baselines with explicit rules for business-critical conditions, then assign every important asset and alert to an accountable team.
- Connect alerts to investigation. Include lineage, recent changes, upstream dependencies, and runbook context so engineers can isolate failures quickly.
Teams should tune alerts using actual workload behavior. Excessive sensitivity creates alert fatigue, while broad thresholds allow corruption to remain hidden. Monitoring should also evolve as new sources, consumers, and data ingestion patterns enter the architecture.
The result is a proactive operating practice: detect unexpected changes, understand their impact, correct the source, and verify recovery before downstream systems continue using unreliable data.

Key takeaways
- Data observability monitors data behavior and pipeline context, not only infrastructure availability.
- Volume, freshness, schema, distribution, and lineage provide complementary views of data health.
- Statistical baselines help identify unexpected conditions that fixed rules may not anticipate.
- Lineage supports both downstream impact analysis and upstream root cause investigation.
- End-to-end coverage protects analytics, machine learning, and automated decisions from silent data corruption.
How Hyperlake helps
Hyperlake lets teams assemble and operate governed data, model, application, and workflow capabilities in infrastructure they or their clients control. Its shared controls include observability and resilience, lifecycle management, access policy, audit, and lineage, while operational procedures vary by engine and solution pack. To discuss an observable data and AI environment for your workload, talk to our team.
Frequently asked questions
Does data observability replace data quality testing?
No. Data quality tests verify known expectations, such as required fields, accepted ranges, or referential integrity. Data observability adds continuous behavioral monitoring that can reveal unknown issues, including abnormal volumes, delayed updates, distribution shifts, and unexpected dependencies. Mature data operations use both approaches together.
Which data observability signals should a team monitor first?
Start with freshness and volume for the datasets that support critical reports, applications, models, or decisions, then add schema, distribution, and lineage coverage. The right order depends on the workload, but prioritizing high-impact data flows produces more useful alerts than attempting to monitor every asset equally from the beginning.
How does data lineage improve incident response?
Data lineage shows where data originated, which transformations changed it, and which downstream assets consume it. During an incident, teams can use that map to identify affected reports or models and trace anomalies toward an upstream source. This reduces manual dependency discovery and helps teams focus remediation on the breaking node.
Can data observability prevent bad machine learning predictions?
Data observability cannot guarantee correct predictions, but it can detect unreliable inputs before or while they affect operational models. Freshness, schema, volume, and distribution monitoring can reveal stale features, missing records, malformed fields, or shifts in input values. Lineage then identifies which models and applications may require review or paused data delivery.