A 200 OK tells you the request finished. It doesn't tell you the answer was any good. LLM observability means rebuilding and judging what happened inside an AI request, not only noting that it completed. It joins end-to-end traces with quality, latency, cost and input-drift signals, so a team can explain why a fast, cheap, technically successful response was still wrong.
Ordinary health signals can't say whether an answer is right for your domain, grounded in approved context, or within policy.
What is LLM observability?
Evidence, request by request, that explains what an AI system did.
Monitoring reports signals you defined in advance. Observability connects those signals to the prompts, context, model calls, tools and outputs behind them.
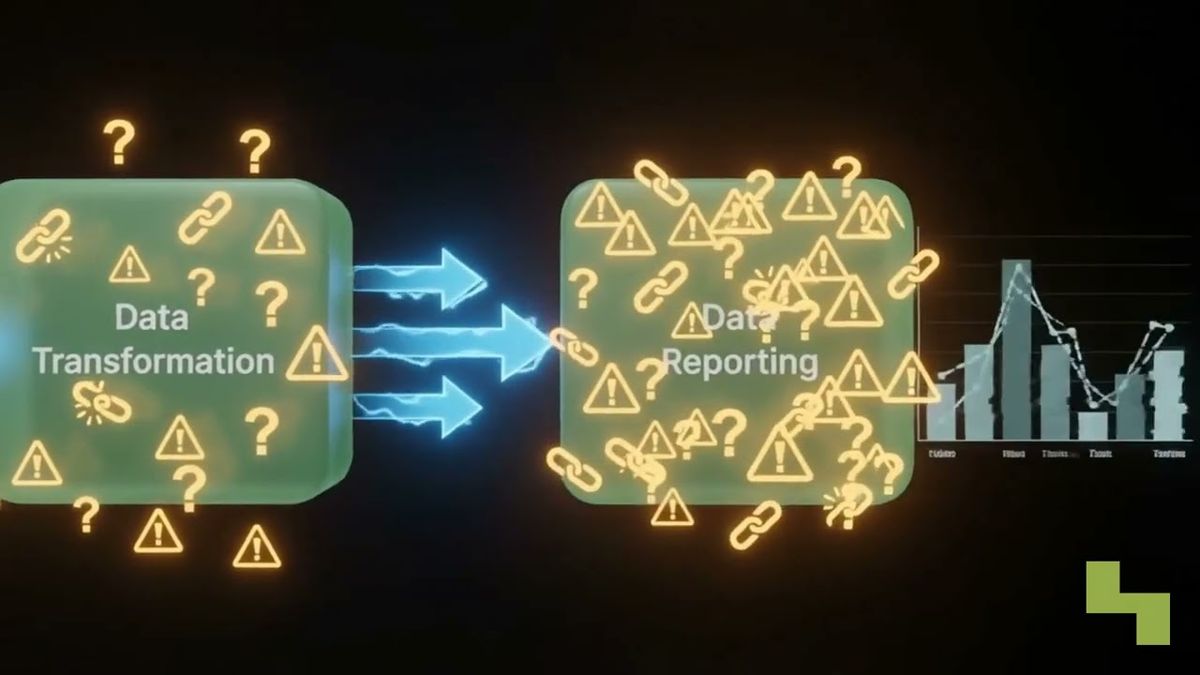
Keep your regular monitoring. Latency, error rates, token use and infrastructure health tell you whether a service is up and inside its limits. But picture an LLM request that returns an HTTP success code, meets its latency target, burns few tokens, and hands back an irrelevant or factually wrong answer. Every dashboard stays green.
That's the gap. Observability keeps enough evidence to investigate the request afterward. Monitoring says latency rose or quality fell. Observability helps an engineer find out whether retrieval, a model call, a tool or some other workflow stage did it.

How do traces explain an LLM request?
Start with the trace. It's the basic unit: one complete record of a single request, cut into spans, where each span covers one operation such as retrieval, model inference or tool execution.
An agent request often has these:
- A retrieval span: which context got picked.
- A model span: the prompt, the model configuration, the response.
- A tool span: the action requested and what came back.
- More model or validation spans that handle downstream results.
Distributed tracing ties the spans together under one trace identity. One model call may trigger several actions further down. With a shared identity you can rebuild the chain and see where latency piled up, where bad context got in, or which step pushed the system toward a bad result.
You're explaining the workflow you can observe. You don't need access to the model's hidden reasoning.

Which LLM observability metrics matter?
Four kinds of signal: quality, latency, cost and drift. Read them together. A system can improve on one while sliding on another.
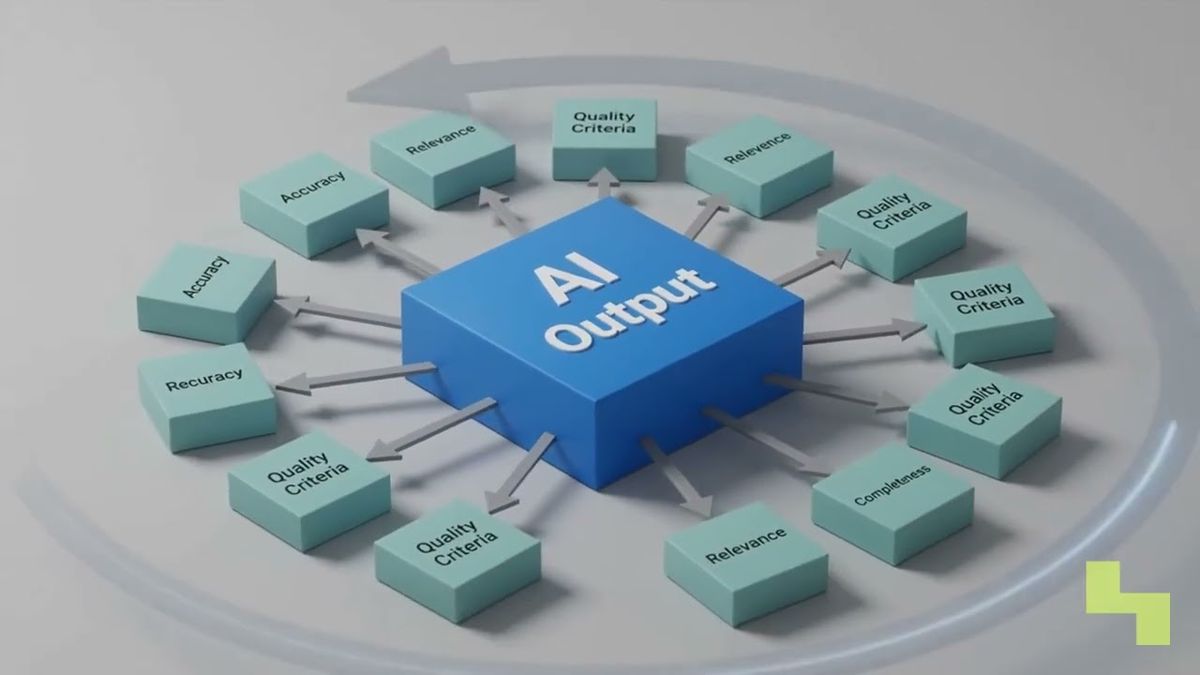
- Quality scores estimate whether outputs are correct, grounded, relevant and in line with policy. Continuous LLM-as-a-judge evaluation can score live samples, but test the judge against representative examples humans have reviewed, and against your domain requirements. A broader LLM evaluation strategy should add deterministic checks wherever possible.
- Latency metrics give total response time and the time each span took. With span-level data you can tell slow retrieval from slow inference, slow tools or slow validation, instead of staring at one opaque number.
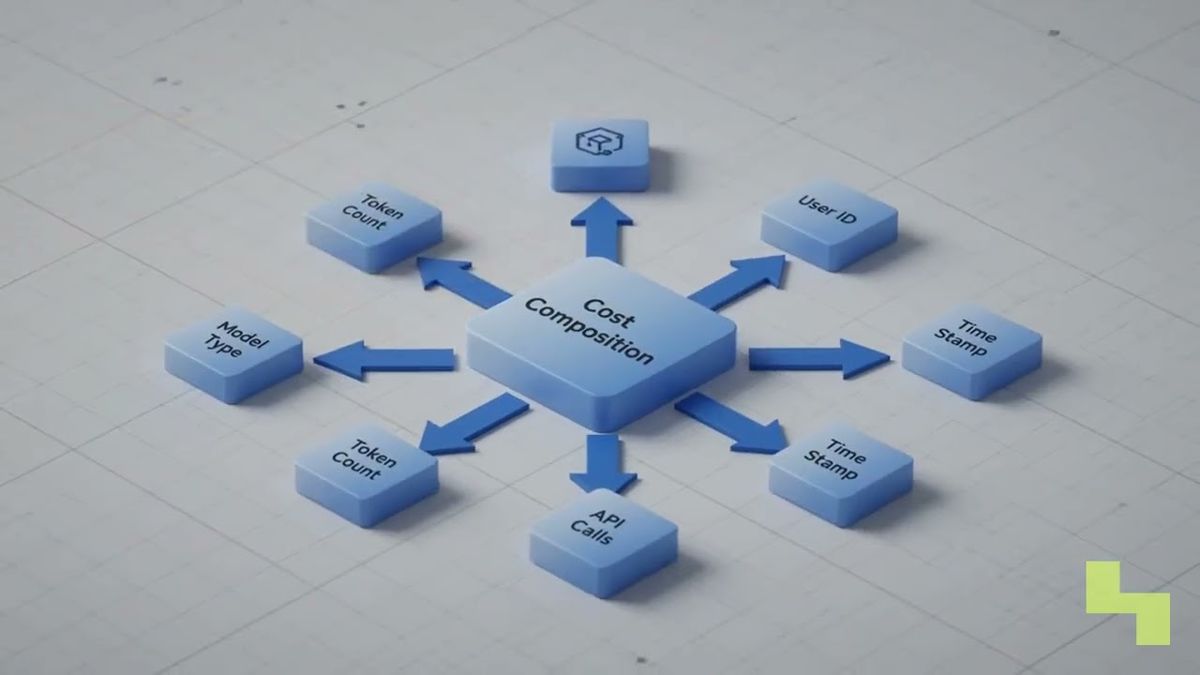
- Cost metrics tie token use and other workload usage to a feature, workflow, model or customer, not just one total. That supports better LLM cost attribution and capacity calls.
- Drift signals fire when incoming prompts, documents or requests wander away from the cases your evaluations cover. Drift doesn't prove an answer is wrong. It does mean your existing quality scores may no longer describe how people use the system.
The hard production problem is the output that's technically valid but wrong for the domain, caught before a user sees it. We'd say that's the whole point of the exercise. You get there by lining up quality evidence with the exact traces, inputs and versions behind each output.
How do you implement LLM observability in production?
Trace everything the same way, and write quality criteria that match how the system is really used. Every important request should be explainable. You shouldn't hoard sensitive data you don't need to get there.
- Define request boundaries. Give each user request a trace identity and carry it through retrieval, model, tool and validation steps.
- Create meaningful spans. Record operation type, duration, status, relevant versions, token usage, and whatever input or output evidence you're allowed to keep.
- Evaluate domain quality. Mix continuous model-based scoring with deterministic rules, sampled human review, and tests built from real failure modes.
- Set baselines. Compare latency, cost, quality and input distributions over time, then chase changes that move together, not lone alerts.
Mind what you collect. Prompts, retrieved documents, tool arguments and model outputs can hold confidential or personal data, so collection should follow your access, redaction, retention and audit policies.
Observability pays off when the evidence is detailed enough to diagnose failures and locked down enough that it doesn't become a new way for data to leak.
How Hyperlake helps
Hyperlake lets teams package data services, model services, applications, policies and monitoring as reusable deployment patterns, in infrastructure they or their clients control. Its shared controls cover observability, resilience, lifecycle and audit, and the operational procedures vary by engine and solution pack. To discuss deploying governed AI workloads with these controls, for LLM inference or anything else, talk to our team.
Frequently asked questions
Can standard application monitoring detect wrong LLM answers?
Mostly not. Standard monitoring catches failed requests, high latency, heavy token use and infrastructure trouble. It usually can't judge whether an answer is correct or fitting for a domain. For that you need quality evaluation plus trace evidence showing the prompt, the retrieved context, the model response and any tool results that matter.
What data should an LLM trace retain?
Keep identifiers, timings, operation types, versions, usage data and the permitted evidence you need to reconstruct a request. Capture prompts, retrieved context, tool arguments and outputs only where policy allows. Sensitive fields may need redaction, restricted access, encryption and set retention periods.
Is LLM-as-a-judge enough for production quality control?
On its own, no. A judge gives you continuous, scalable scoring on things like relevance, groundedness or policy alignment, but you have to check its behavior against representative cases humans have reviewed. For consequential or ambiguous outputs, you still want deterministic checks, domain tests, user feedback and human review.
What does input drift mean if the model has not changed?
It means production prompts, documents, users or tasks have moved away from what your evaluations represent. The model can be identical while the context around it shifts. Drift is a warning that earlier quality results may not predict current behavior, so review your evaluation coverage.